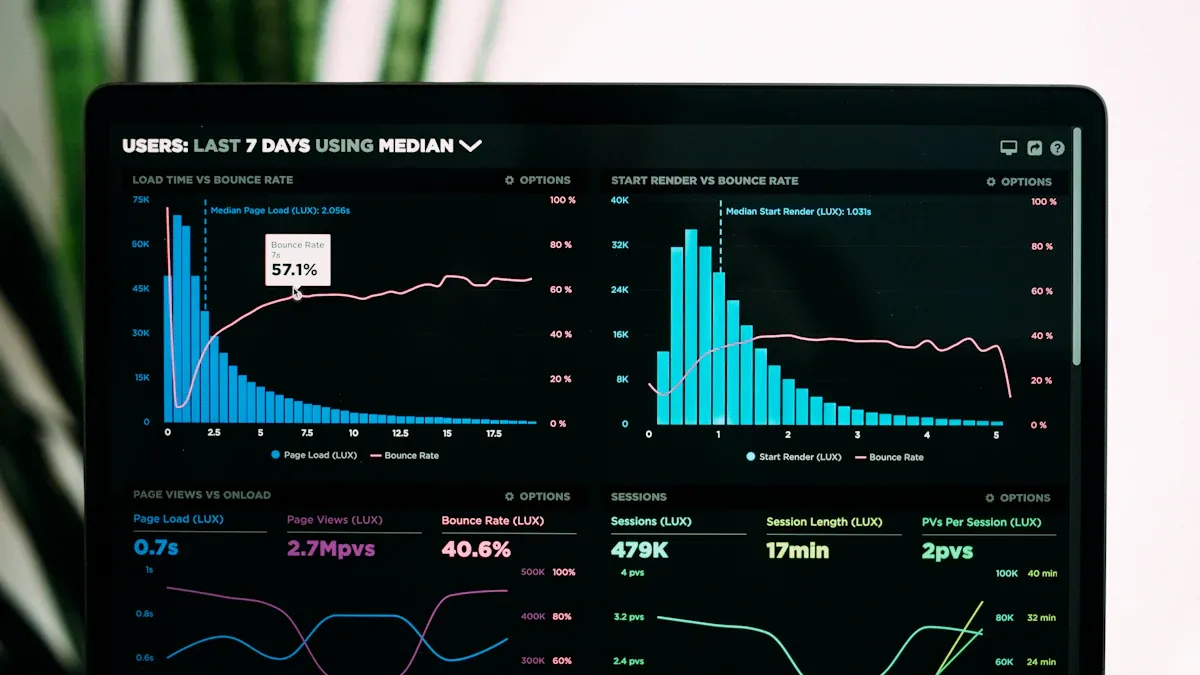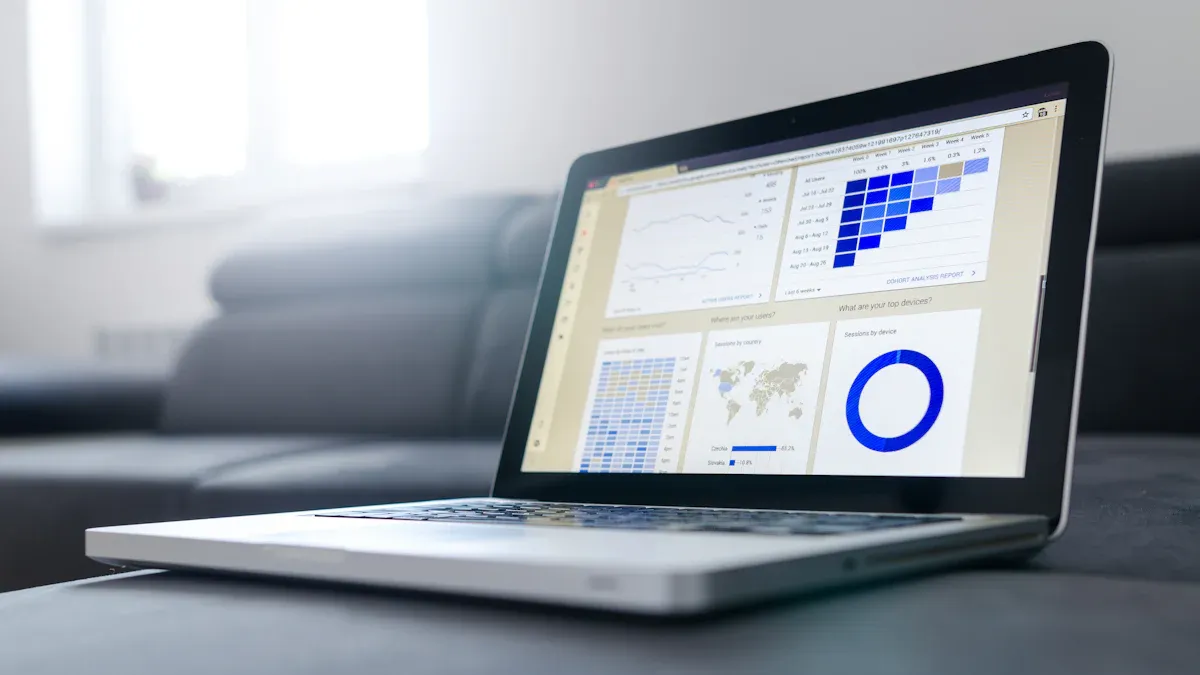
An ad revenue analytics dashboard helps you see all your ad earnings in one spot. You no longer need to jump between platforms or get lost in piles of data. With a dashboard, you track your data from different sources and spot trends fast. Many beginners worry about too much data or not knowing where to look. Don’t stress! You can start with just a few simple numbers and build confidence as you go.
Tip: Focus on the basics first. You will learn more as you use your ad revenue analytics dashboard.
Key Takeaways
Ad revenue analytics dashboards put all your ad earnings together. This helps you see and understand how your ads are doing.
A dashboard saves you time and lowers mistakes. It helps you find problems and chances fast with updates that happen right away.
Begin by looking at a few main metrics like click-through rate, conversion rate, and revenue. This helps you feel sure and make your ads better little by little.
Dashboards let you try new ideas and reach the right people. They help you make good choices that can help your ad revenue grow.
Check your dashboard often and keep it easy to use. This stops confusion and lets you change your ad plan quickly and well.
Ad Revenue Analytics Dashboard Basics

What Is It?
You may wonder what an ad revenue analytics dashboard does. Think of it like a control center for your ad earnings. This dashboard shows all your important numbers in one place. You do not need to look at lots of websites or reports.
An ad revenue analytics dashboard is a tool for digital advertising. It brings together key metrics for you. You can watch, study, and improve your ad money efforts. You get charts and graphs that help you see how your ads do over time.
Most dashboards have some main parts. Here is what you often find:
High-Level KPIs: You see cost, revenue, profit, ROAS, CPA, and conversions as single value tiles. These give you a quick summary.
Monthly Spend, Revenue, Conversions, and Profit by Publisher: Charts break down how each channel performs.
Monthly Efficiency Metrics: Line graphs show trends in CPC, CPA, ROAS, conversion rate, and CTR.
Monthly Spend by Publisher Share: Pie charts and stacked bars show how you split your budget.
Monthly CPA and ROAS by Publisher: Track cost efficiency and return on ad spend for each publisher.
Data Visualization Elements: Charts, graphs, tables, and scorecards help you spot trends.
Key Financial Metrics: Metrics like MRR, ARR, churn rate, ARPU, CAC, LTV, and revenue growth.
Financial Statements: Balance sheets, income statements, and cash flow statements add context.
Customer Revenue Overview: Segment by customer type, industry, region, or deal size.
Revenue Differentiation: See results by product line, subscription tier, or service category.
Customizable Features: Filter and drill down for tailored insights.
Access Control: Role-based permissions keep sensitive data safe.
Forecasting and Predictive Insights: Get projections based on past data.
Performance Benchmarks: Compare against targets, previous periods, and industry standards.
Cross-Functional Insights: Connect marketing analytics, sales, and customer success data.
Tip: You do not need every feature right away. Start with the basics first. Add more features when you feel ready.
Why Use One?
You may ask, “Why should I use an ad revenue analytics dashboard instead of tracking everything by hand?” The answer is easy. Dashboards make ad analytics simple and quick.
Dashboards help you learn more about your audience. You can see which ads work well. You can also see which ads need help. You can watch your ads in real time. You can fix problems before you lose money.
Audience segmentation helps you show ads to the right people. You can test different ads and see which ones do better. Predictive analytics tell you what could happen next. You can plan ahead. Dashboards save you time by putting all your ad data together. You do not need to copy numbers or wait for reports.
Here are reasons publishers pick dashboards over manual tracking:
Dashboards help you learn about your audience so you can personalize ads.
Real-time monitoring lets you fix problems fast.
Audience segmentation helps you target ads to certain groups.
A/B testing helps you improve your ads.
Predictive analytics help you guess future ad results.
Dashboards cut down on manual work and bring data together.
Insights help you spend money wisely, earn more, and make users happy.
You get more than just numbers. Dashboards show you a clear view of your ad analytics. You can make smart choices. You can react fast to changes in user actions and ad results.
Dashboards also help publishers make better choices. You see all your key monetization metrics in one spot. Real-time charts and filters help you find trends and chances to earn more. You can spot problems fast and change your plan to earn more money.
Note: Dashboards help you work smarter. You spend less time making reports. You spend more time growing your ad revenue.
Dashboard Benefits
Actionable Insights
When you use a dashboard for your advertising, you turn complex data into clear answers. You do not have to guess what works. The dashboard shows you which ads get clicks, which pages earn more, and where your audience spends time. This helps you spot trends and fix problems fast. For example, you might see that ads on your mobile pages earn less than on desktop. You can then change your strategy to boost your revenue.
A dashboard lets you track key metrics like eCPM, conversion rate, and click-through rate. These numbers help you understand your advertising performance. You can see which campaigns bring in the most money and which need improvement. Many publishers report higher ROI and better advertiser relationships after using dashboards. They can charge more for targeted ads and grow their ad revenue.
Tip: Use your dashboard to test new ideas. Try different ad placements or formats. Watch the data and see what works best.
Here is a quick look at how dashboards help you make better decisions:
Metric | What It Shows | Why It Matters |
|---|---|---|
eCPM | Income per 1,000 ad views | Measures ad efficiency |
Conversion Rate | Actions after ad clicks | Shows campaign success |
Click-Through Rate | How often ads get clicked | Reveals ad appeal |
Real-Time Tracking
With real-time tracking, your dashboard updates as soon as new data comes in. You do not have to wait for daily or weekly reports. You see how your advertising performs every minute. If something goes wrong, like a drop in fill rate or a sudden change in impressions, you can react right away.
Real-time dashboards help you spot issues before they hurt your revenue. For example, if you notice a drop in bids or a problem with ad viewability, you can adjust your pricing or ad placement instantly. Companies like Reddit use real-time dashboards to keep their advertising running smoothly and to give advertisers up-to-the-minute results.
You also save time because the dashboard brings all your advertising data together. No more switching between tools or waiting for reports. You get a full view of your ad performance and can make smart choices fast.
Note: Real-time dashboards help you stay ahead in the fast world of digital advertising. Quick action means better results and more revenue.
Key Metrics to Track

Understanding the right advertising analytics metrics helps you make smart choices. You do not need to track everything at once. Start with the basics and build from there. Let’s break down the most important metrics you will see in your ad revenue analytics dashboard.
Revenue
Revenue is the total money you earn from your ads. This number shows how well your advertising is working. If you want to grow your business, you need to watch your revenue closely.
Here are some key revenue metrics you should know:
Average Revenue Per User (ARPU): This tells you how much money you make from each user. For example, if you earn $100 from 200 users, your ARPU is $0.50.
Average Order Value (AOV): This shows the average amount spent each time someone buys from you. If you have 10 sales worth $500, your AOV is $50.
Customer Lifetime Value (LTV): This is the total revenue you expect from a customer over their time with you. If a user keeps coming back, their LTV goes up.
Customer Acquisition Cost (CAC): This is how much you spend to get a new customer. If you spend $200 on ads and get 10 new customers, your CAC is $20.
Monthly Recurring Revenue (MRR) and Annual Recurring Revenue (ARR): These show how much predictable revenue you get each month or year, which is important for subscription businesses.
Tip: Tracking these advertising analytics metrics helps you see if your ads bring in enough money to cover your costs and grow your business.
Impressions & Clicks
Impressions count how many times your ad appears on a page. Clicks show how many people actually click on your ad. Both are basic advertising analytics metrics, but they tell different stories.
Impressions: If your ad shows up 1,000 times, that’s 1,000 impressions. This shows your ad’s reach.
Clicks: If 50 people click your ad out of those 1,000 impressions, you have 50 clicks. This shows engagement.
Impressions give you visibility. Clicks show interest. If you see lots of impressions but few clicks, your ad might not be interesting or relevant. When you track these advertising analytics metrics together, you can spot what works and what needs fixing.
Note: High impressions with low clicks may mean you need to change your ad design or message.
CPM, CPC, CTR
These three advertising analytics metrics help you understand costs and engagement.
Metric | What It Means | Example | Why It Matters |
|---|---|---|---|
CPM (Cost Per Mille) | Cost for 1,000 ad impressions | $5 CPM means you pay $5 for 1,000 views | Good for brand awareness |
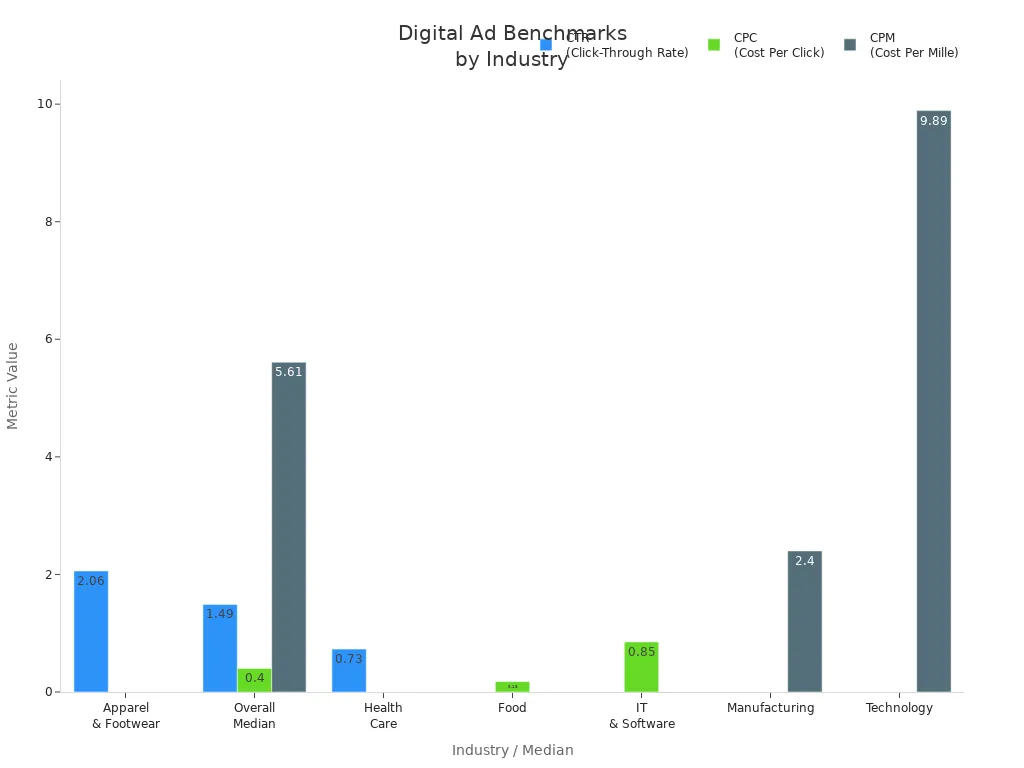
CPC (Cost Per Click) | Cost for each click | $0.40 CPC means you pay $0.40 per click | Shows how much you pay for engagement |
CTR (Click-Through Rate) | % of impressions that get clicks | 1.5% CTR means 15 clicks per 1,000 views | Measures ad effectiveness |
Here’s a quick look at industry benchmarks:

CPM helps you see if your ads reach enough people for the price.
CPC tells you if you pay too much for each click.
CTR shows if your ad grabs attention.
Tip: If your CTR is low, try changing your ad image or headline to make it more interesting.
Fill Rate & eCPM
Fill rate and eCPM are two advertising analytics metrics that show how well your ad space makes money.
Fill Rate: This is the percentage of ad requests that actually get filled with an ad. If you have 1,000 ad slots and 900 get filled, your fill rate is 90%. A low fill rate means you are missing chances to earn revenue.
eCPM (Effective Cost Per Mille): This tells you how much money you make for every 1,000 ad impressions, no matter how you get paid (clicks, views, or actions). You calculate it like this: (Total Earnings ÷ Total Impressions) × 1,000.
If your eCPM goes up, you make more money for the same number of views. But if you set your prices too high, your fill rate might drop, and you could lose revenue. You want to find the right balance between fill rate and eCPM to get the most out of your advertising analytics.
Note: Focus on total revenue, not just one metric. Sometimes a lower fill rate with a higher eCPM brings in more money.
Advertising Analytics KPIs
There are many advertising analytics KPIs, but here are the most useful ones for beginners:
KPI Name | Description | Why It Matters |
|---|---|---|
Impressions | Number of times your ad is shown | Measures how many people see your ad |
Clicks | Number of times your ad is clicked | Shows audience engagement |
Click-Through Rate (CTR) | Clicks divided by impressions | Tells you if your ad is effective |
Conversion Rate | % of users who take action (buy, sign up) | Shows if your ad leads to results |
Cost Per Acquisition (CPA) | Cost divided by number of new customers | Helps you see if your ads are worth the cost |
Bounce Rate | % of visitors who leave after one page | Shows if your site keeps people interested |
Video Completion Rate (VCR) | % of viewers who finish your video ad | Measures video ad engagement |
Tip: Start by tracking just a few advertising analytics KPIs. As you get comfortable, add more to your dashboard.
These advertising analytics metrics help you see the full picture. You can spot trends, fix problems, and make better choices. When you use your ad revenue analytics dashboard, you get a clear view of your ad performance and can grow your revenue over time.
Manual vs. Dashboard Tracking
Manual Methods
Some people start by tracking ad revenue with spreadsheets. Many beginners use Excel or Google Sheets for this. They write down how much they spend on ads and how well the ads do each day. Here is what you do with manual tracking:
You download data from each ad platform, like Google Ads or Facebook Ads, as a file.
You copy and paste the numbers into your spreadsheet.
You use simple math to add up clicks and impressions. You also figure out things like CTR.
You look at each ad’s results and try to find patterns.
Manual tracking lets you choose what data to keep. You can organize it any way you want. You can pick where to put ads and change how they look for your audience. This way helps you learn the basics and see how your ad money grows step by step.
But manual tracking takes a lot of time. You have to log in to many sites, download files, and update your sheet every day. It is easy to make mistakes, like copying the wrong number or missing an update. You also do not get real-time data, so you might not see problems right away.
Here is a table that shows how manual tracking and dashboard tracking are different:
Aspect | Manual Ad Revenue Tracking | Dashboard-Based Tracking |
|---|---|---|
Time Efficiency | Takes a lot of time because you enter data yourself | Saves time by pulling data automatically |
Error Proneness | Easy to make mistakes like copying wrong numbers | Fewer mistakes because it is automatic |
Data Consolidation | You must log in to each platform one by one | Puts all your data in one place |
Opportunity Identification | You might miss trends if you forget or are late | Shows new data fast so you can act quickly |
Customization | Hard to change for different people | Easy to show the right data for each user |
Tip: Manual tracking is okay for small jobs, but it gets tough when your ad revenue grows.
Dashboard Integration
Using a dashboard makes things much easier. A dashboard brings data from all your ad platforms together. You do not need to copy numbers or worry about missing anything. The dashboard updates by itself, so you always see the newest results.
Dashboards help you find problems and good chances fast. Each team member can see the data they need. This makes teamwork better and helps everyone make smart choices. You can set up your dashboard to show only the most important numbers for each person.
With a dashboard, you save lots of time every week. You do not have to make reports by hand. The dashboard connects with other systems and ad servers. This gives you a full view of your ad campaigns. You can use AI tools to get tips and predictions, which helps you earn more money.
Dashboards also help you make fewer mistakes. Automation means you do not have to copy and paste as much. Your data is more correct. You get real-time updates, so you can act fast if something changes. This helps you make more money and keep your business running well.
Note: A dashboard lets you spend more time growing your ad revenue, not just tracking numbers.
Setup Guide
Are you ready to make your first ad revenue analytics dashboard? Let’s go through the steps together. You will see that starting with google analytics dashboards and other tools is simple.
Choose a Dashboard Tool
First, pick a dashboard tool that works for you. Many beginners like google analytics dashboards because they are free and simple. You can also try Databox, Zoho Analytics, or Klipfolio. Here is a table with some popular choices:
Dashboard Tool | Key Features | Best For |
|---|---|---|
Google Data Studio | Free, customizable, Google integration | Google users |
Databox | Real-time tracking, mobile-friendly, 70+ integrations | KPI tracking |
Zoho Analytics | Drag-and-drop, AI insights, real-time dashboards | Small businesses |
Klipfolio | Custom metrics, real-time data visualization | Marketing teams |
Pick a dashboard that is easy to connect, shows data right away, and is clear to read. Google analytics dashboards are great because they are easy to set up and have strong reports.
Connect Ad Platforms
Next, link your ad platforms to your dashboard. Most google analytics dashboards let you connect Google Ads, AdSense, and Facebook Ads. Here is how you do it:
Make your Google Ads or AdSense account.
Connect your account to google analytics dashboards in the Admin area.
For Facebook, use UTM codes and connect in the dashboard’s settings.
You can also add other networks, like LinkedIn or Twitter, to see all your ad data.
Customize Layout
Now, change your dashboard to fit your needs. Use widgets to show the numbers you care about most. Pick colors that match your brand. Organize your google analytics dashboards with headers and comment boxes to make them easy to read. You can add your own data if you want more details.
Tip: Start with a simple dashboard. Add more analytics when you feel ready.
Set Alerts
Set alerts so you know when something big happens with your ad revenue. Most google analytics dashboards let you make alerts for things like fewer clicks or higher costs. You can get messages by email or Slack. Use colors to see important changes quickly.
Share & Collaborate
Share your dashboard with your team. Google analytics dashboards make it easy to invite people, set who can see what, and work together. Shared workspaces help everyone stay updated. Working together helps your team find trends and make smart choices.
Note: Test your dashboard with real people and change it if needed. This helps keep your analytics easy to use and helpful.
Dashboard Tips
Regular Review
Your dashboard should help you, not make things harder. Check your dashboard often to find problems early. You can also spot new ways to grow. If you spend a lot or need quick results, look at your dashboard every day. For most campaigns, checking once a week is enough. Monthly checks help you see bigger patterns and make smart changes.
Here’s a simple guide for how often to check your dashboard:
Review Frequency | Purpose and Focus | Key Activities / Checks |
|---|---|---|
Daily | Look for problems in big or urgent campaigns | Check spend, conversion rates, CPC/CTR spikes, delivery status |
Weekly | Find patterns and improve active campaigns | Check search queries, placements, audience performance, ad creative |
Monthly | Make smart changes and review trends | Look at KPI trends, budget use, campaign setup |
Tip: Checking your dashboard often helps you fix problems fast. It also helps you keep your ad money safe.
Avoid Mistakes
Mistakes can happen if you do not pay attention. Many beginners make the same errors. You can avoid them by using good habits and staying focused.
Do not track too many KPIs at once. Pick 3–5 that fit your goals.
Always use UTM parameters. This helps you know where your visitors come from.
Make sure you know which ads bring results. Do not mix up conversions.
Do not forget mobile metrics. Mobile users act differently, so check mobile conversion rates and CPC.
Remember that holidays and events can change your numbers.
Use cross-channel attribution. See how all your marketing channels work together.
Note: A simple dashboard helps you focus on what matters. It also stops you from getting confused by too much data.
Grow Revenue
Your dashboard can help you earn more ad money. Use what you learn to make smart choices. Try these ideas:
Strategy Category | Description & Examples |
|---|---|
Ad Network Selection | Pick networks like Google AdSense or Media.net for better payouts. |
Ad Placement Optimization | Put ads above the fold or in-content to get more clicks. |
Mobile Optimization | Use responsive ads so they look good on phones and tablets. |
User Experience Balance | Limit ad density and keep your site fast to reduce bounce rates. |
Programmatic Advertising | Automate ad buying with AI for targeted ads and real-time analytics. |
Data-Driven Decisions | Run A/B tests and segment users to improve ad performance. |
Diversify Ad Formats | Add video ads, sponsored content, or affiliate marketing to reach more people. |
Addressing Challenges | Use ad-block detection and native ads to handle ad blockers. |
Regulatory Compliance | Stay transparent and follow rules like GDPR. |
Key Metrics to Monitor | Track CTR, CPC, RPM, and bounce rate in your dashboard for better results. |
Emerging Technologies | Try AI, blockchain, or AR to make your ads more engaging. |
Tip: Use your dashboard to try new ideas. See what works best for your audience. Even small changes can help you earn more.
You get big benefits when you use an ad revenue analytics dashboard. You can track your top campaigns, spot trends, and make smart choices fast. Start with a simple dashboard and focus on key metrics like CTR, conversion rate, and ROAS. Real-time data and clear reports help you see what works and fix problems quickly.
Ready to grow your ad revenue? Try a dashboard tool today and see how easy it is to boost your results!
FAQ
What is the easiest way to start with an ad revenue analytics dashboard?
You can start by picking a free tool like Google Data Studio. Connect your main ad accounts. Use a simple template. Focus on just a few key numbers first. You will learn more as you go.
How often should I check my dashboard?
Check your dashboard at least once a week. If you run big campaigns or see sudden changes, look every day. Regular checks help you spot problems early and find new ways to grow your revenue.
Can I use a dashboard if I have ads on different platforms?
Yes! Most dashboards let you connect many ad networks at once. You can see all your data in one place. This saves you time and helps you compare results across platforms.
What should I do if my dashboard looks confusing?
Tip: Hide extra charts and focus on 3–5 main metrics.
Ask your team for feedback. Try using simple colors and clear labels. A clean dashboard makes it easier to spot trends and take action.
See Also
How G37 Apple CarPlay Adapters Transform Your Driving Experience
Easy Methods To Stream YouTube Using Apple CarPlay
Best AI Video Devices For Vehicles Evaluated In 2025
