
You need to evaluate local taxi density using data. Focus on real numbers, not estimates. Use clear definitions and precise measurements to identify where taxis cluster. Consider the city’s layout, traffic flow, and population movement. Advanced tools like real-time data platforms enable you to quickly detect patterns. Taking a step-by-step approach provides the best investment insights.
Key Takeaways
Use real taxi data like GPS and public records. This helps you see where taxis gather. It also helps you find busy areas more easily.
Watch important ride numbers like trip starts and popular routes. Look at driver activity to know taxi demand. This can help make service better.
Think about things like weather, events, and changes in public transit. These things can change how many people need taxis.
Use advanced tools like clustering algorithms and Local Maximum Density. These tools help you find real busy spots and avoid mistakes.
Compare taxi data from different cities to see market trends. This helps you avoid risks and find the best places to invest and grow.
Evaluate Local Taxi Density

Taxi Density Defined
When you check local taxi density, you count taxis in an area at a certain time. Urban studies often use grid cells to measure this. These grids are usually 1 km by 1 km. Sometimes, people use smaller grids like 100 or 300 meters. Smaller grids help you see more details. The table below lists grid types and their sizes:
Grid Type | Scale Range (meters) | Example Scales (meters) |
|---|---|---|
Regular Hexagonal | 100 – 1000 | 100, 300, 600, 900 |
Square Grids | Corresponding to hex | 100, 300, 600, 900 |
Grids as small as 50–100 meters show busy spots near buildings. These grids help you compare different parts of a city. Advanced clustering algorithms, like DBSCAN+, work with big taxi data. These tools clean and group the data to find where taxis gather most. Visualization methods from these tools help you see taxi clusters and how they change.
Why Density Matters
Taxi density affects service and profits. If you check local taxi density, you can find where there are too many or too few taxis. Not enough taxis means people wait longer. Too many taxis means drivers may not get enough rides. In 2015, more than 88% of people waited over 10 minutes for a taxi in some cities. This shows that bad density hurts service.
You can use GPS data to watch taxis in real time. This helps match taxis with people faster. It also helps drivers earn more money. The chart below shows how taxi density and demand affect driver pay and fairness:
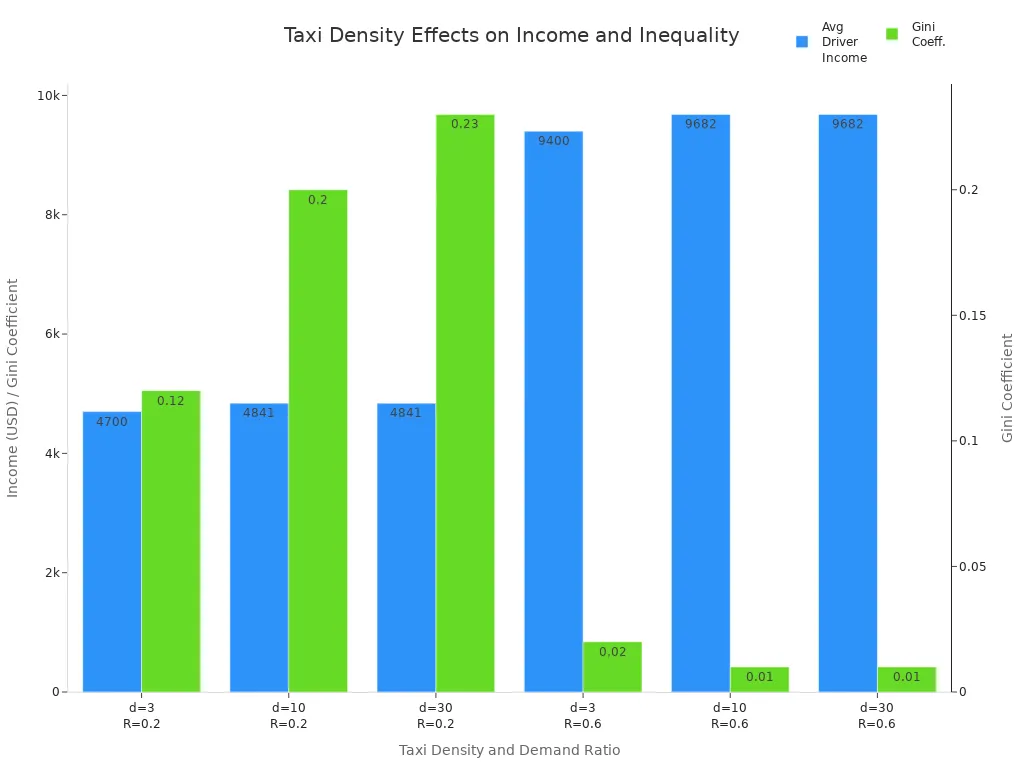
When you check local taxi density, you can find the right number of taxis. This helps people get rides quickly and drivers make enough money. Finding this balance helps you make better investment choices and keeps the taxi market healthy.
Key Metrics and Demand Factors

Ride Density Metrics
You have to watch certain numbers to see taxi activity. Transportation analysts use important signs to measure ride density. These numbers help you find patterns and make smart choices.
Trips Start and End: Find where people get in and out most. Look for places that come up often and faraway drop-offs.
Origin-Destination Pairs: Check which routes are most popular. See which trips earn the most money.
Paths and Flow: Watch the paths that riders use again and again. Notice how movement changes at different times.
Idle Spots and Walls: Find where drivers wait for new rides. See which places or roads drivers skip.
Requests per Hour: Count how many ride requests happen in each area.
Conversion and Completion Rates: Track how many rides drivers accept and finish.
Driver Utilization and Total Kilometers Driven: See how busy drivers are and how far they go.
Revenue Distribution: Check how money and costs change in different city parts.
Tip: Ride density numbers change during busy and slow times. In Madrid, the south gets busy in the morning, and the north in the afternoon. The center can be crowded even when it is not rush hour. Travel times can go up by 40% in the morning. Even when it is not busy, downtown can still have delays.
City | Peak Hour Ride Density / Travel Time Pattern | Off-Peak Hour Ride Density / Travel Time Pattern |
|---|---|---|
Sydney | Two main busy times in the morning and afternoon | Fewer rides; coverage changes more during the day |
Stockholm | Two main busy times in the morning and afternoon | Fewer rides; less coverage than Sydney |
São Paulo | Longer travel times in the day, not as busy at rush hours | Fewer rides; PT covers about 80% of the area |
Amsterdam | Longer travel times in the day, not as busy at rush hours | Fewer rides; PT covers about 40% of the area |
Various | PT: Longer travel times when busy, not much change in space | PT: Longer travel times late at night because service is less |
Demand Drivers
Many things change how many people need taxis. You should watch for changes in weather, events, and transit. Rain makes more people pick taxis instead of walking or taking the bus. When it rains a lot, it is harder to find a taxi, especially in the morning. Fewer people use public transit when the weather is bad, so more use taxis for easy rides.
Metro service also changes demand. If the metro works well, more people use ridesourcing and taxis, especially when it rains. Big events, like concerts or sports games, can make demand jump fast. Bad weather or problems with public transit make people change how they travel, so more take taxis. You need to notice these patterns to make the best investment choices.
Data Collection Methods
Public and Platform Data
You can find useful taxi density data from many sources. Public records, like the NYC Green Taxi Trip dataset, give lots of trip details. This dataset shows where taxis pick up and drop off people. It also tells you trip times and if it was a holiday. These records are cleaned, so you can see busy places and times. Smart card data and Automatic Vehicle Location (AVL) data show travel patterns too. These sources help you track how taxi activity changes by place and time.
Old taxi service data is still helpful, especially in cities with few ride-hailing apps. For example, in Chengdu, researchers used old taxi data to study demand before ride-hailing apps were common. Local government records, like Yellow Cab trip datasets, count trips in each area. These records often mix with other city signs to guess demand and surge pricing.
Feature | Correlation with Surge Multiplier (Pearson’s r) | Mean Squared Error (MSE) in Prediction |
|---|---|---|
Yellow Cab trips | 0.43 | 0.00355 |
Foursquare Places | 0.42 | 0.00416 |
Foursquare check-ins | 0.35 | 0.00412 |
Foursquare travel spots | 0.10 | 0.00519 |
Decision Tree Regressor (all features combined) | 0.59 | 0.00332 |
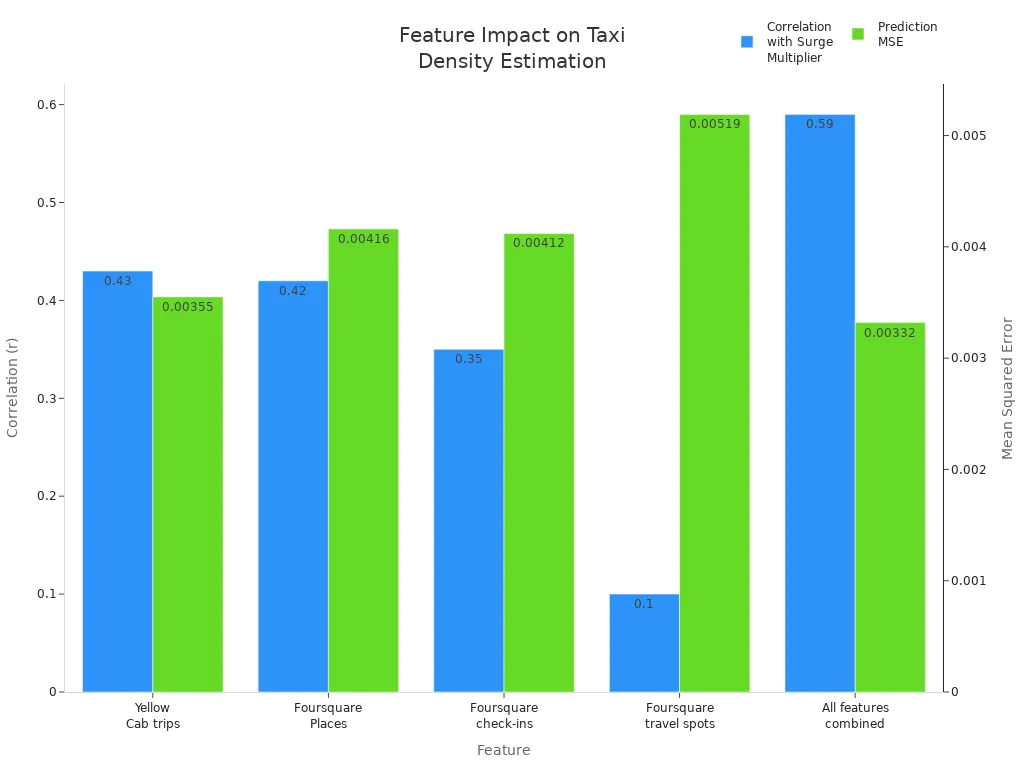
You should use real-time data from GPS taxis and traffic APIs too. Real-time data lets you see changes in demand and traffic right away. This helps you find busy spots and change your investment plan fast.
Tip: Real-time data helps you react to sudden changes, like weather or big events, and keeps your taxi density guesses correct.
Field Surveys
Field surveys give you direct information from the street. You can send teams to watch taxi activity at important places. They count taxis, check wait times, and write down passenger pickups. This works well where digital data is missing or not good.
You can use mobile apps or simple forms to collect survey data too. Field surveys help you check if public and platform data is right. When you mix survey results with real-time GPS data, you get a full view of taxi density. This hands-on way makes sure your investment choices use the best and newest information.
Analyzing Taxi Density Data
Spatial and Temporal Patterns
You need to check where and when taxis gather in a city. Taxi data often shows that taxis group together in certain places. For example, GPS data can show taxis pick up and drop off people in some areas more often. These groups usually match important places like job centers, shopping areas, or homes. This information helps you see where people need rides most.
Taxi activity also changes over time. You will notice daily and weekly patterns as people move around. There are more taxi rides during morning and evening rush hours. Weekends and holidays can change these patterns. By watching these trends, you can guess when and where demand will go up or down.
Studies show that traditional taxis often gather in busy places with many roads. This happens because drivers look for passengers. E-hailing taxis cover bigger areas and follow city borders more closely. These differences help you see how taxi services meet city needs.
You can use spatial analysis tools to map these patterns. For example, Moran’s I test can check if taxi demand groups in some districts. You can also use regression models to see how points of interest, land use, and transport hubs affect taxi rides. Using these methods together gives you a full view of how taxi demand changes by place and time.
Tip: When you check local taxi density, always look at both where and when taxis gather. This helps you find hidden busy spots and not miss important changes in demand.
Local Maximum Density (LMD)
To find the busiest taxi spots, you should use advanced density estimation methods. Local Maximum Density (LMD) is a top choice. LMD looks for the highest number of taxis in small areas. This method gives you clearer and more reliable results than just counting or using simple grids.
LMD works well because it uses more details than just taxi numbers or area size. It can tell real busy spots from random groups. LMD also gives you more trust in your results. For example, LMD is more accurate and better at guessing where taxis will be needed next. It makes fewer mistakes and works well even in tricky city layouts.
Metric / Comparison Aspect | LMD Performance | Baseline (Score) Performance | Bounding Box Features Performance | Notes |
|---|---|---|---|---|
Meta Classification Accuracy | Highest among compared methods | Lower than LMD | Between LMD and Score baseline | LMD uses a richer feature set beyond score and box features, improving classification |
AUROC (Area Under ROC Curve) | Superior, with improvements especially on complex datasets (nuScenes, Aptiv) | Lower than LMD | Better than Score baseline | LMD achieves better separation of true positives and false positives |
Meta Regression R² | Highest R² values indicating better IoU estimation | Lower R² values | Intermediate R² values | LMD provides sharper and more reliable localization precision estimates |
False Positive / False Negative Trade-off | Best trade-off across entire threshold frontier | Generates more false negatives and false positives | Intermediate trade-off | For fixed FP count, LMD reduces FN errors by more than half compared to score baseline |
Robustness to Threshold Variation | Maintains superior performance even at low score thresholds (e.g., 0.1) | Performance degrades or less robust | Intermediate robustness | Non-monotonic transformation in LMD improves ranking and average precision curves |
Dataset Complexity Impact | Larger improvements on more complex datasets (nuScenes, Aptiv) | Smaller improvements on simpler datasets (KITTI) | Similar trend as LMD but less pronounced | Indicates LMD’s feature set better captures complex data characteristics |
LMD not only makes results more accurate but also easier to trust. Its guesses stay close to real numbers, and it handles changes in data well. When you use LMD, you can find real busy spots and avoid mistakes from simple methods.
You can also use clustering algorithms like OPTICS to find busy spots. These tools look at pick-up places and group them together. By changing settings like neighborhood size and minimum points, you can find over 70% of pick-ups in central areas. Reachability plots help you see these groups clearly. This way, you know where taxis should go to meet demand and cut waiting times.
Clustering algorithms show areas with lots of passenger demand.
You can change settings to find both very busy and somewhat busy spots.
These methods help you send taxis to the right places and make service better.
Benchmarking
Benchmarking lets you compare taxi density and how taxis work in different cities. You can use this data to see how your target city compares to others. This helps you spot if there are too many taxis, how much people need rides, and how well taxis do their jobs. By comparing these things, you can make smarter investment choices.
When you benchmark, you also learn about local rules and what customers like. Some cities have strict taxi rules, while others are more flexible. You can use this to plan your business and avoid mistakes.
Benchmarking also helps you change your services to fit each city. If business travelers like loyalty programs in one city, you can offer the same in new places. If shared rides are popular, you can focus on cheaper options. This helps you meet customer needs and stand out from others.
Note: Always use benchmarking when you check local taxi density. It gives you a clear look at the market and helps you avoid big mistakes.
Investment Insights and Pitfalls
Market Saturation
You should look for signs of market saturation before investing in a taxi business. If there are too many taxis and not enough riders, profits go down and competition gets harder. Here are some warning signs:
Revenue in the U.S. taxi market is dropping, with a negative CAGR of -4.43% expected from 2025 to 2030.
Fewer people are using taxis, with user penetration falling from 15.2% in 2025 to 11.6% in 2030.
Ride-hailing apps like Uber and Lyft make it tough for regular taxis to keep up.
Customers want rides that are easier, safer, and cheaper, which ride-hailing often gives.
Many taxi companies now use both street hails and app bookings to stay in business.
Governments have a hard time making fair rules for both taxis and ride-hailing.
In lots of countries, the offline taxi business keeps getting smaller.
When there are more taxis than people who need rides, new companies have a hard time. Profits get smaller, and prices can change a lot. Too many taxis can even hurt the community and push some drivers out of work.
Growth Potential
You can still find places to grow in markets that do not have enough taxis or are just starting out. Look for these things:
Cities with more people and traffic jams need better ways to get around and last-mile rides.
Weak public transit means more people use taxis.
More people have smartphones and higher incomes, so they use ride-hailing apps more.
New technology like AI, real-time analytics, and cashless payments make taxi services better.
Some governments help by making rules easier or supporting electric taxis.
Partnerships and ride-sharing help reach more customers.
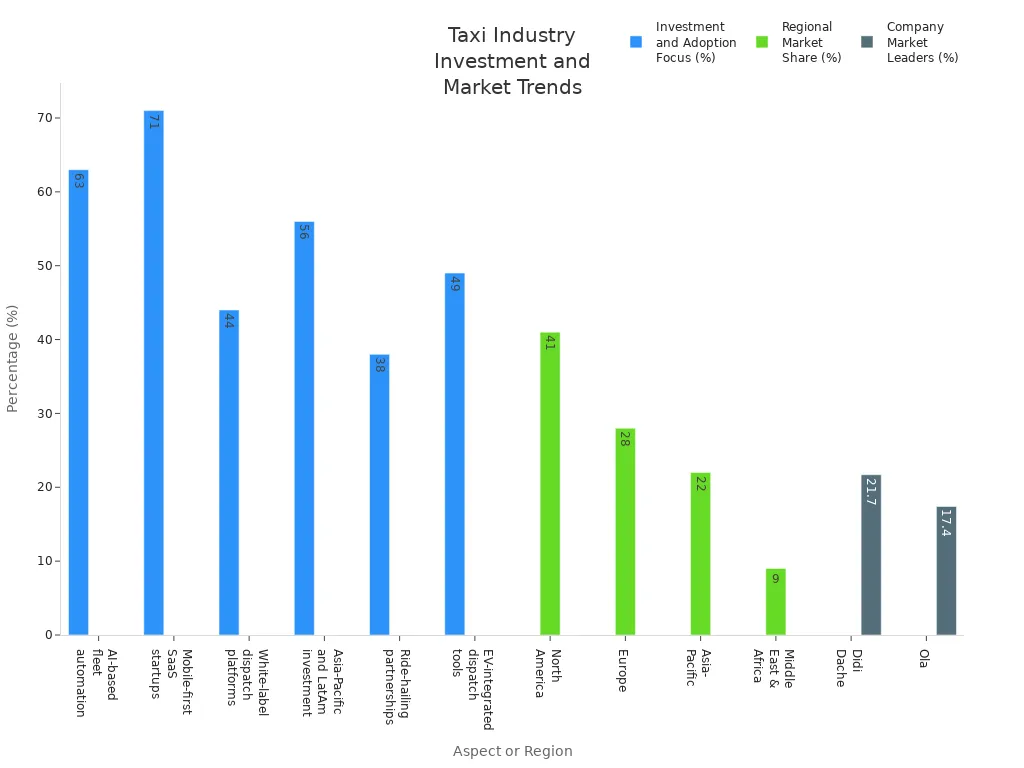
Investors often look at AI fleet automation, SaaS platforms, and electric vehicles. In places like Latin America and Asia-Pacific, more tourists and city growth mean more people need rides. You can find good chances by watching these trends and picking markets that can still grow.
Common Mistakes
Many investors lose money because they do not understand taxi density data. You should try to avoid these mistakes:
Forgetting about long-term costs like fixing cars, insurance, and car wear.
Not thinking about strict taxi rules and fees.
Thinking taxi licenses will always be worth more, even as ride-hailing grows.
Not seeing how ride-hailing companies skip some costs and beat regular taxis.
Not paying attention to changing customer habits and new technology.
Tip: Always check the real costs, local rules, and market trends before you invest. Smart research helps you avoid losing money and find real chances.
To check local taxi density for investment, you need to do a few things. First, clean the GPS data and look for where people get in and out of taxis. Next, use special clustering tools like DBSCAN+ to find places with lots of taxis. Then, make pictures or maps to show these busy spots so you can understand them better.
When you use spatial analysis, demand factors, and real-time data together, you can find places to grow, lower your risks, and make better choices. If the city is very complicated, ask an expert or do your own research to solve special problems.
FAQ
What is the best way to collect real-time taxi data?
You should use GPS data from taxis and traffic APIs. These sources give you up-to-date information about where taxis are and how busy each area is. Real-time data helps you make quick and smart investment decisions.
How often should you analyze taxi density?
You should check taxi density at least once a month. If you want to spot trends or react to sudden changes, you can review the data weekly. Regular analysis helps you stay ahead of market shifts.
Can you use public data for small cities?
Yes, you can use public data for small cities. Local government records and field surveys work well when digital data is limited. You can also ask drivers and riders for feedback to fill in any gaps.
What tools help you find taxi hotspots?
You can use clustering algorithms like DBSCAN+ or OPTICS. These tools group busy areas and show where taxis gather most. Mapping software also helps you see patterns and spot high-demand zones.
Why does taxi density change during the day?
Taxi density changes because people travel at different times. Morning and evening rush hours see more rides. Events, weather, and public transit issues also affect when and where people need taxis.
See Also
Budget-Friendly Portable CarPlay Solutions Specifically For BMW F10
Cost-Effective Portable CarPlay Choices Suitable For All Drivers
Discovering CarPlay Options For BMW F30 Infiniti And More
